
Best Horse Racing Betting Sites – Bet on Horse Racing in 2026
Loading...
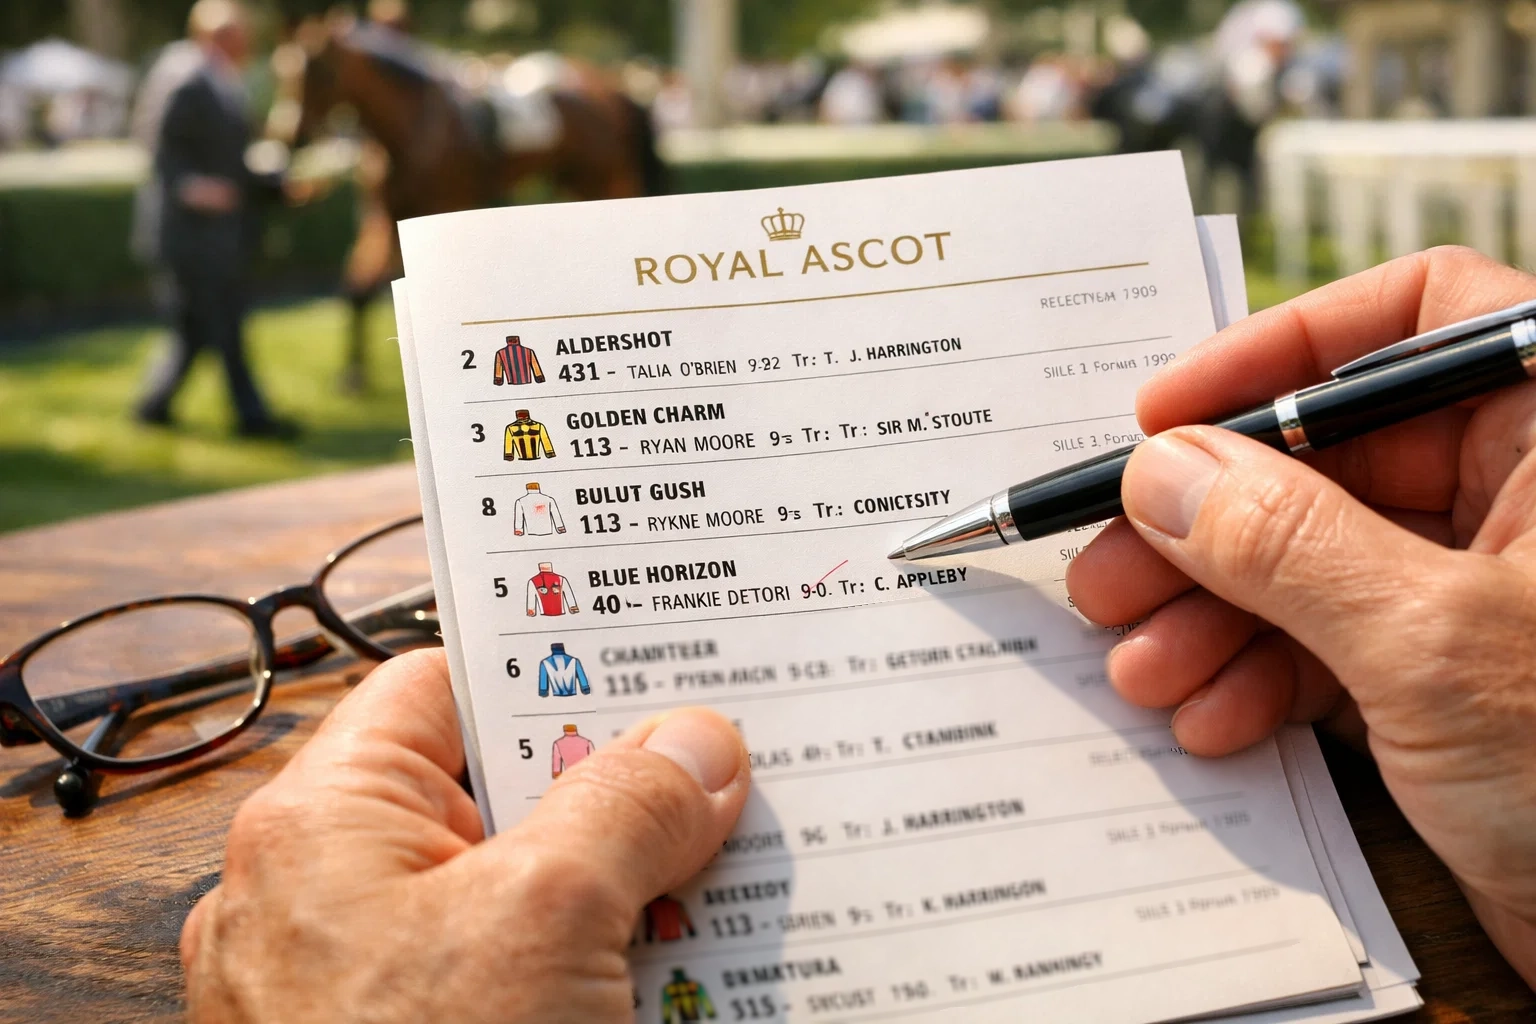
Race cards contain compressed information that experienced punters decode instantly but newcomers find impenetrable. Those strings of numbers and letters next to each horse’s name represent form, weight, breeding, and connections, all condensed into space-efficient notation that rewards interpretation.
Royal Ascot race cards carry particular density because the meeting attracts quality horses with extensive racing histories. A Group 1 contender might show form figures spanning multiple seasons, with codes indicating course preferences, ground conditions, and competitive levels. Extracting meaning from this data separates informed betting from guesswork.
This guide explains race card anatomy for Royal Ascot 2026, covering form figure interpretation, weight and handicap reading, and how trainer and jockey statistics inform selections. The information exists on every race card. Understanding it transforms how you approach betting decisions.
Anatomy of a Race Card
Race cards present information in standardised formats that become intuitive with familiarity. The horse’s name appears prominently, typically accompanied by age, colour, sex, and breeding details. A five-year-old bay gelding by Frankel tells you the horse is mature, male, castrated, and sired by an outstanding miler who now produces quality offspring.
Form figures appear as a string of numbers showing recent finishing positions. Reading right to left, these represent the most recent races first. A horse showing “2131” finished first last time out, third before that, first before that, and second in the earliest shown race. The sequence reveals current trajectory: improving, declining, or inconsistent.
Letters within form figures indicate non-completion. “F” means fell, “U” means unseated rider, “P” means pulled up, and “R” means refused. These matter less at Royal Ascot’s flat racing where falls are rare, but understanding the notation prevents confusion when encountering it.
Course and distance indicators show previous performance at Ascot specifically and at the race distance. “CD” next to a horse’s name means it has won over both course and distance previously. This experience often proves valuable, particularly at Ascot’s unique straight and round courses that don’t suit all running styles.
Draw position for flat races appears as a number indicating starting stall allocation. At Royal Ascot, draw advantages vary by race configuration: some races favour low draws, others show no clear bias. Checking historical draw analysis for specific races informs how much weight to place on stall position.
Weight carried in handicaps shows as stones and pounds, determining how much additional burden each horse carries based on official ratings. Lighter weights theoretically compensate for lower ability, while top weights carry heaviest burdens. The relationship between weight and form reveals whether horses are well-treated or harshly handicapped by the assessor.
Understanding Form Figures
Form figures tell stories that simple finishing positions don’t fully capture. A sequence of “4321” suggests steady improvement, with the horse peaking for its most recent victory. A sequence of “1-45” (the dash indicates a break between seasons) might show a horse returning below previous peak but still competitive.
Numbers in brackets indicate finishing positions from the previous season. “(2)312” means the horse finished second in its final run last season, then third, first, and second this season. Comparing current form against previous seasons reveals whether horses have maintained, improved, or declined.
Superscript notation adds context. A “1¹” indicates a winning margin of one length. A “4²⁵” shows the horse finished fourth, beaten 25 lengths by the winner. Large beaten distances suggest either non-completion of effort or genuine inability to compete at the level. Small margins indicate competitive performances despite not winning.
Course form requires particular attention at Ascot’s distinctive configurations. The straight course and round course test different attributes. A horse with strong straight course form might struggle on the turn-heavy round course, and vice versa. Checking which configuration each historical form line occurred on refines assessment.
Class indicators in Racing Post and similar publications show the grade of race for each form figure. Winning a Class 4 handicap differs substantially from winning a Group 1. Form achieved against inferior opposition might not transfer when the horse steps up in class at Royal Ascot. Assessing form quality rather than just form quantity guides realistic expectation.
Ground preferences emerge from consistent form patterns. A horse showing best figures on soft going probably won’t reproduce that form on firm Royal Ascot ground. The going description in form (“s” for soft, “gf” for good to firm, etc.) reveals whether previous performances came in conditions similar to those expected.
Weights and Handicaps
Handicap races assign weights designed to give all horses theoretically equal winning chances. The official handicapper assesses each horse’s ability based on form and assigns a rating. Higher-rated horses carry more weight, compensating for their superior ability. The system aims for blanket finishes where any horse could win.
Weight-for-age allowances adjust handicap burdens in races open to horses of different ages. Younger horses receive allowances reflecting their natural development relative to older, fully mature competitors. A three-year-old racing against older horses carries less weight to account for physical immaturity.
Penalties apply to recent winners, adding weight to horses who’ve won since the official ratings were published. These penalties maintain competitive balance when horses have improved beyond their current official mark. Well-handicapped horses operate from ratings below their actual ability, while harshly-penalised horses face elevated burdens.
The relationship between weight and distance affects how burdens translate to finishing positions. One pound of additional weight theoretically equates to approximately one length per mile of race distance. Over Royal Ascot’s varying distances, these calculations inform whether weight differences are significant or marginal.
Non-handicap races assign weights based on conditions rather than ratings. Weight-for-age scales standardise burdens in Group races, while conditions races might specify set weights with allowances for certain categories. Understanding what type of race you’re assessing determines how to interpret the weights displayed.
Jockey and Trainer Stats
Trainer statistics reveal operational patterns that inform selection. Strike rates show winning percentages across different race types, courses, and conditions. A trainer with a 30% strike rate at Royal Ascot outperforms one showing 10%, assuming reasonable sample sizes. These numbers appear in detailed race cards and form services.
Jockey bookings carry significance beyond rider quality. When a leading trainer uses their stable jockey, the booking confirms primary intentions. When they book a different rider, it might indicate second-string status or specific tactical requirements. First-time jockey bookings sometimes signal renewed confidence in a horse’s chances.
Jockey form shows recent riding performance independent of stable connections. A jockey riding winners consistently brings confidence regardless of which trainer employs them. Conversely, jockeys experiencing cold spells might lack the momentum that accompanies winning runs.
Trainer-jockey combinations often develop patterns at specific meetings. Certain partnerships consistently outperform at Royal Ascot while underperforming elsewhere. Historical combination data, available through Racing Post and similar services, identifies these productive partnerships.
First-time cheekpieces, tongue-ties, and other equipment changes appear in race cards and can signal trainer intentions. Equipment additions often accompany genuine improvement attempts, though success rates vary by change type. Noting equipment patterns across a trainer’s string reveals operational habits.
Reading Between the Lines
Race card information rewards detailed examination that casual glancing misses. Form figures, weights, trainer statistics, and equipment notes combine into comprehensive portraits of each runner’s profile and prospects.
The punters who profit from race card analysis are those who move beyond surface-level numbers to understand the stories behind them. Every horse arrives at Royal Ascot through a journey recorded in its form. Learning to read that journey informs better betting decisions.